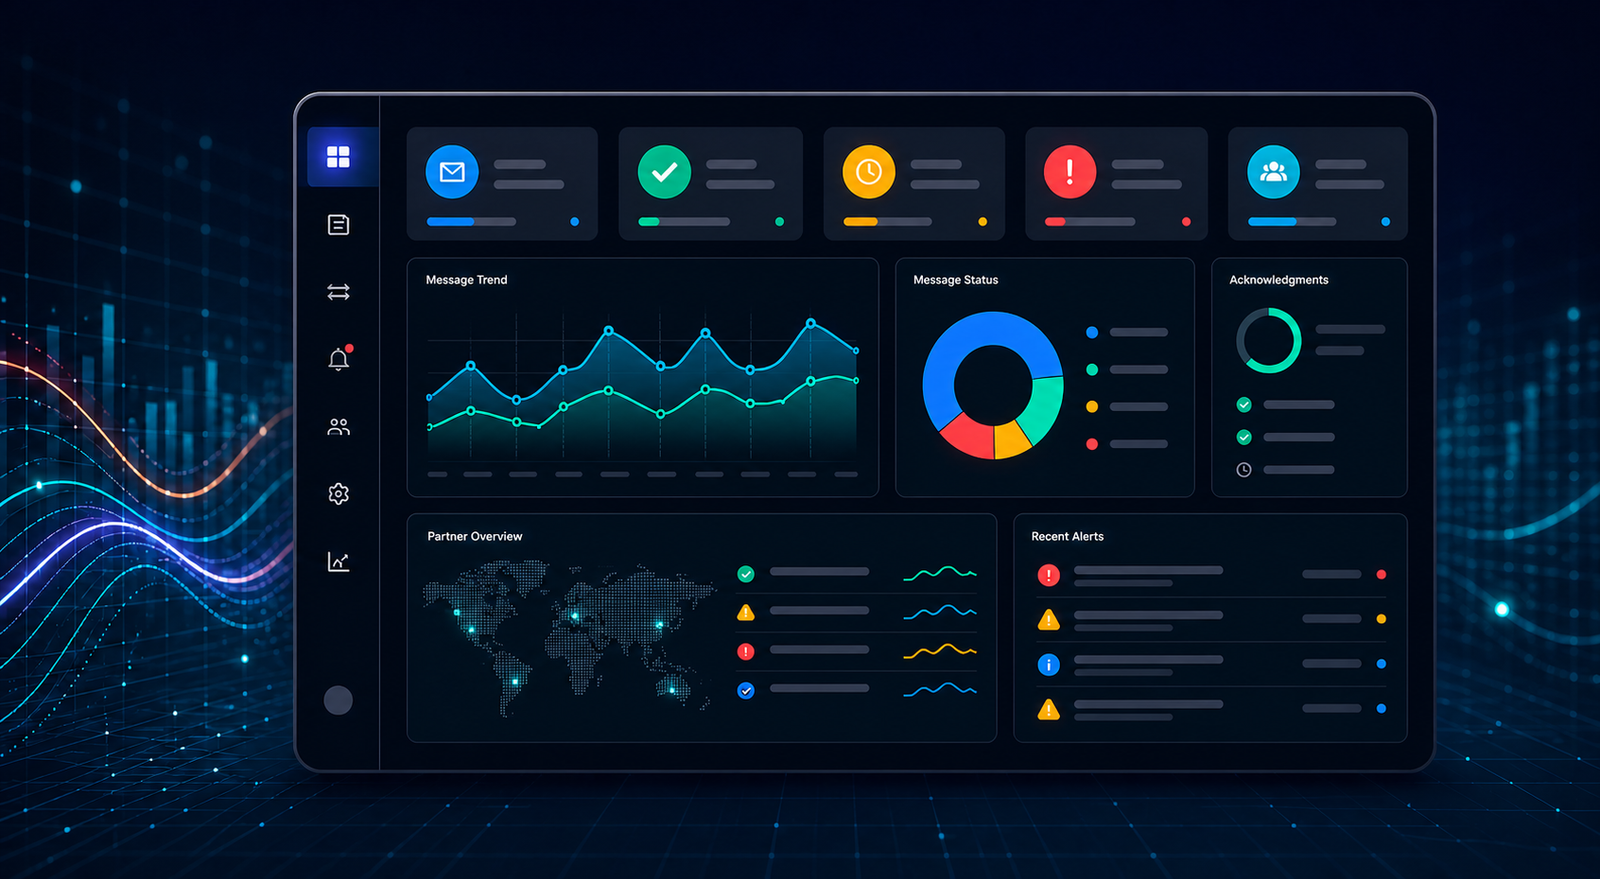
EDI Monitoring Dashboard: Features That Matter for Visibility and Error Tracking
- DataSync
- 14 Aug, 2026
- 03 Mins read
- Edi
An EDI platform may process hundreds or thousands of transactions every day. Without a strong monitoring dashboard, businesses can miss failed messages, delayed acknowledgments, duplicate transactions, and partner-specific issues.
That is why EDI monitoring is not optional. It is a core part of reliable EDI operations.
Why an EDI Dashboard Matters
An EDI dashboard gives operations and support teams visibility into the health of message processing across all trading partners.
It helps teams answer questions like:
- Which messages failed?
- Which partner is having issues?
- Did we receive an MDN or 997?
- Are retries increasing?
- Is any transaction stuck in processing?
Without this visibility, troubleshooting becomes slower and business impact increases.
Core Features an EDI Dashboard Should Include
Message Status Tracking
Every transaction should have a clear status such as:
- Received
- Validated
- Processed
- Failed
- Retried
- Acknowledged
This helps teams understand exactly where a message is in the lifecycle.
Trading Partner Visibility
The dashboard should allow filtering by trading partner.
This makes it easier to detect:
- Partner-specific failures
- Repeated routing issues
- Communication problems with a single endpoint
Transaction Type Visibility
Teams should be able to filter by transaction types such as:
- 850 Purchase Order
- 810 Invoice
- 856 ASN
- 997 Functional Acknowledgment
This is useful for both support and operational reporting.
MDN and 997 Tracking
Acknowledgment visibility is one of the most important dashboard features.
The dashboard should show:
- MDN received or missing
- 997 received or rejected
- Time taken to receive acknowledgments
This helps teams quickly identify communication and validation problems.
Error Details
A failed message should never appear as only a red status.
The dashboard should also show:
- Error reason
- Validation failure details
- Mapping issues
- Communication errors
- Retry history
Actionable error detail saves significant support time.
Retry and Reprocessing Controls
Operations teams often need to retry failed messages or send them for manual review.
A good dashboard should support:
- Retry counts
- Exception queue visibility
- Reprocessing workflows
- Audit trail for retry actions
Search and Filtering
Fast search is essential in high-volume EDI environments.
Useful filters include:
- Message ID
- Trading partner
- Transaction type
- Date range
- Status
- Control number
These filters help support teams find issues faster.
Audit and Compliance Visibility
An EDI monitoring dashboard should also support audit needs.
Important audit fields may include:
- Message timestamps
- Sender and receiver IDs
- Processing actions
- Acknowledgment history
- User actions on retries or exceptions
This is especially useful for enterprise environments with compliance and customer support requirements.
Best Practices for Dashboard Design
To make the dashboard useful in real operations, businesses should:
- Show live processing status
- Highlight failed and delayed messages clearly
- Support partner and transaction filters
- Preserve history for investigation
- Avoid hiding technical details behind vague status labels
The goal is not only to display data, but to help teams act quickly.
Conclusion
An effective EDI monitoring dashboard gives businesses visibility, control, and faster troubleshooting across trading partners and transaction types.
By focusing on message status, acknowledgment tracking, error details, retries, and audit history, businesses can build a dashboard that supports reliable and scalable EDI operations.
Our Team Members